Using Jupyter and Colab
WORK IN PROGRESS
There are several ways to access Jupyter, all slightly different. If you use notebook, or if you use Visual Studio Code you could use the Microsoft Jupyter extension.
At the top of the file you need to use a %matplotlib magic command with one of the following options: inline, notebook, widget.
%matplotlib inline
import matplotlib.pyplot as plt
from spatialmath.base import *

trplot(transl(1,2,3))
trplot(transl(2,3,4))

Multiple plots within a cell are added to the figure. The resulting graphic in the notebook is a static PNG image, which cannot be rotated or zoomed.
%matplotlib notebook
import matplotlib.pyplot as plt
from spatialmath.base import *

trplot(transl(1,2,3))
trplot(transl(2,3,4))
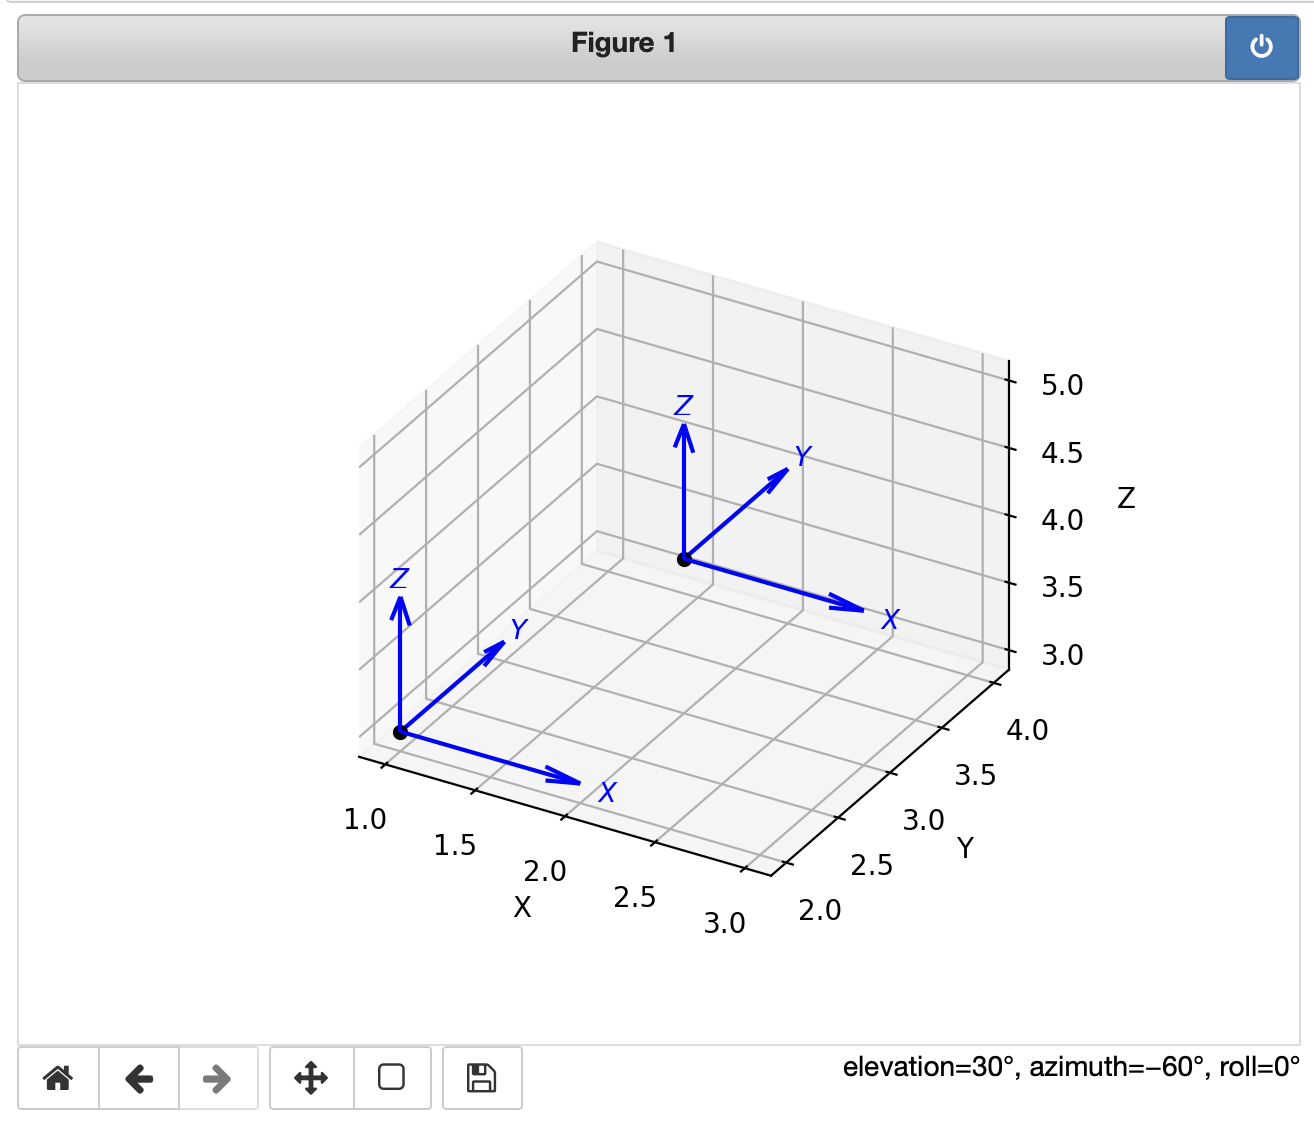
Multiple plots within a cell are added to the figure. The resulting graphic can be rotated or zoomed using the mouse.
While the figure is active or on (the power switch icon), any figures created in subsequent cells are added to that figure. If the figure is turned off, then new figures will be added to a new figure which starts in the on state.
%matplotlib widget
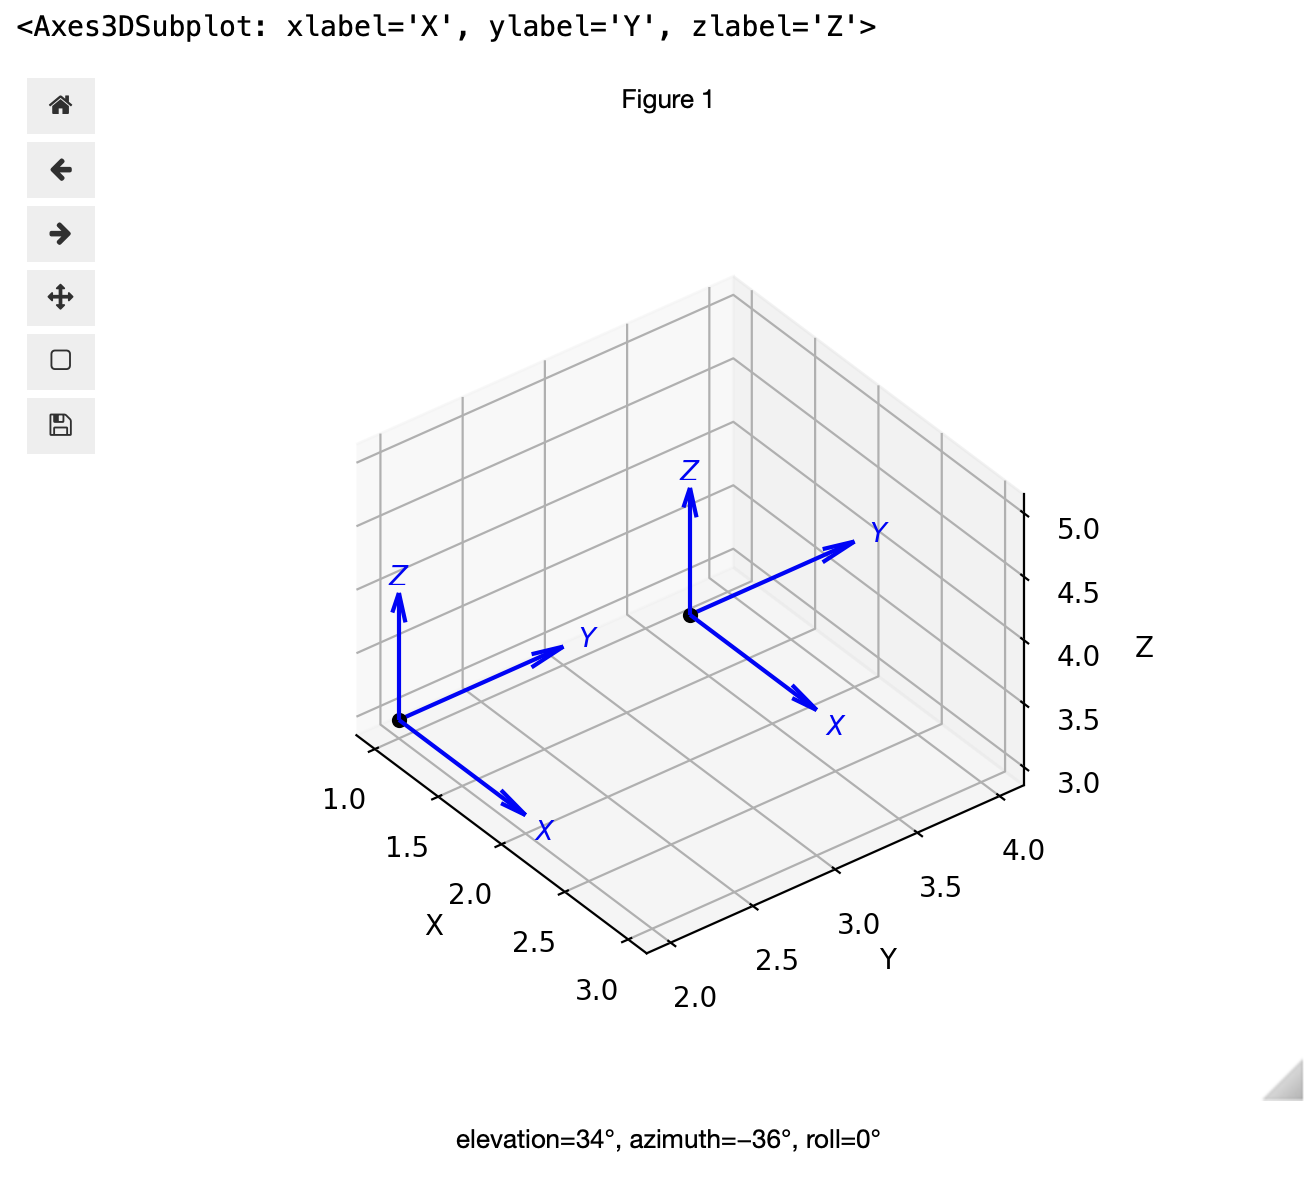
widget is a synonym for ipympl and the package ipympl must be installed. This backend provides much smoother and more performant axes rotation and zooming than notebook. The ipympl package also supports a rich set of user interface components like sliders and radio buttons,
If the code to be executed is
tranimate(trans(1,2,3))
then, except for the inline case, it will be animated inside the notebook figure and the axes can be rotated and zoomed manually at the same time. The animation runs just once, and the cell has to be re-executed to re-run the animation.
For the inline case we can render the animation to an HTML5/Javascript fragment
html = tranimate(transl(1,2,3), movie=True)
from IPython.core.display import HTML
HTML(html)
and then display it.

To see all the options use
%matplotlib --list
Switching between graphical modes should depend only the %matplotlib magic command but in practice switching is not so reliable. Occasionally the Jupyter kernel may need to be restarted.
A cell can create multiple figures, and you can use figure and axis handles to control which one is drawn into. Once the cell has stopped executing the figures are closed off, and can no longer be added to.
The inline and widget modes work as described above. For widget you must first do this
!pip install ipympl
%matplotlib widget
from google.colab import output
output.enable_custom_widget_manager()